
How to Look Up El Paso County Jail Population Data
The main source for El Paso County jail population data is the El Paso County Sheriff's Office. The office posts annual reports on the EPSO annual report page. Each report lists bookings, releases, and average daily population by year. The 2020 CJCC Metrics Report adds quarterly average daily population and the pretrial share. State data lives on the Colorado DCJ Jail Data Dashboard page, which holds the definitions and the county roll-up that feeds the state report.
National benchmarks come from the Bureau of Justice Statistics. BJS runs the Annual Survey of Jails and the Census of Jails. The Vera Institute pulls those files and posts state-level series on the Colorado state incarceration trends page. Each source updates on a different clock. The Sheriff's annual report drops once a year. CJCC updated by quarter in 2020. BJS jail data lags by 12 to 24 months. Read the date label first. Match the year before comparing any two figures.
Numbers fall into two buckets. Official jail counts come straight from EPSO booking and release logs. Estimated rates and racial-disparity numbers come from BJS and Vera using survey samples. Mark both when citing. Lean on Sheriff data for the county figure. Use BJS for the national rate.
Readers wanting an at-a-glance read should start with the most recent EPSO annual report on the index below.
The annual report archive holds every El Paso County jail population data release the Sheriff has published. The lead-in for that archive page is the official source list. Use the file below to see how the index is laid out.
The image links to the official archive on the Sheriff's website. From there each year opens its own PDF with the jail figures inside.
View the EPSO annual report index for the latest El Paso County jail population data.
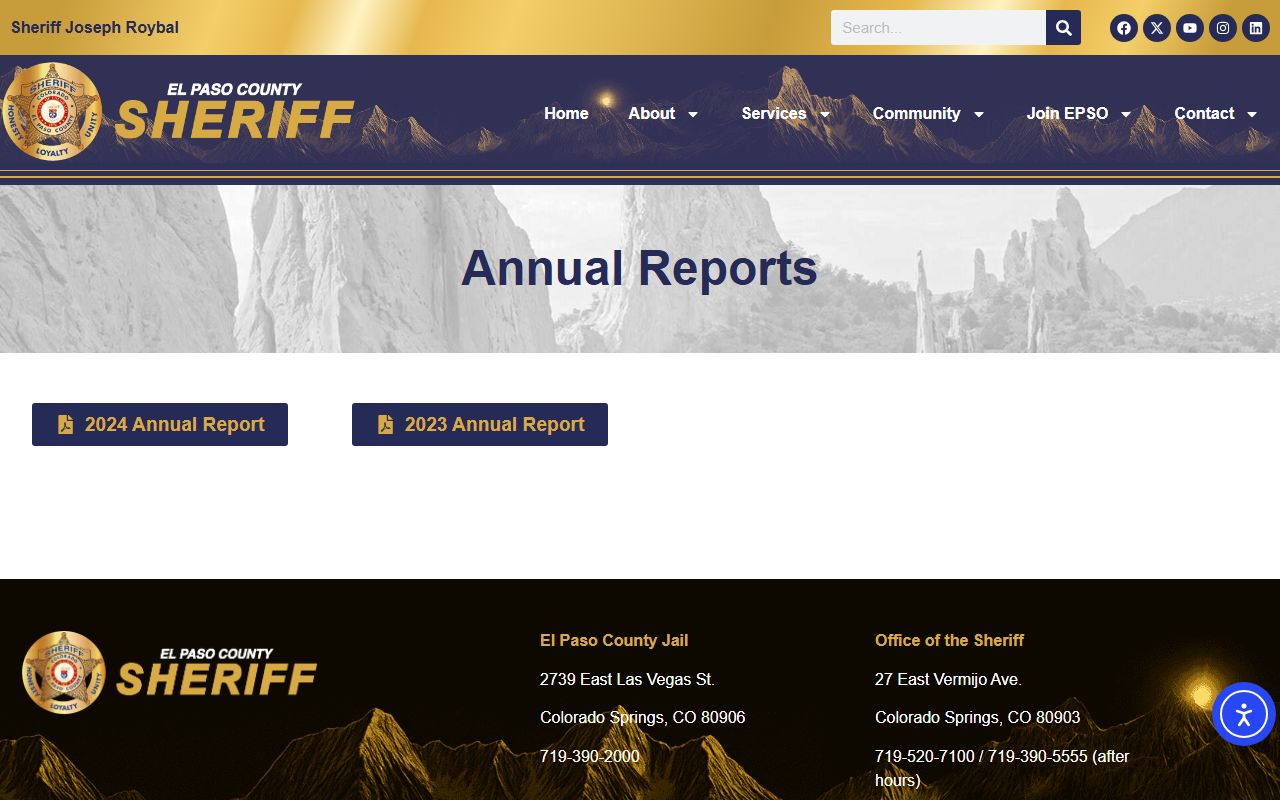
The page lists each annual report by year and shows where to find jail counts inside each PDF.
El Paso County Jail Capacity Overview
The El Paso County Criminal Justice Center is the main jail. It sits at 2739 East Las Vegas Street in Colorado Springs. The Office of Justice Programs profiled the site as a cost-efficient county detention center, built at slightly under $34,000 per bed including program and support costs. The American Correctional Association has accredited it. The National Institute of Corrections has used it as a Planning of New Institutions training site. Bed counts cited in older OJP material are historical. Current rated capacity should be confirmed against the most recent EPSO annual report before any final number is published.
The table below holds the El Paso County jail capacity row used on this site. Rated capacity is a research gap in the public source set. The number listed is "verify in latest annual report" rather than a guess.
| Facility | Address | Rated Capacity |
|---|---|---|
| El Paso County Criminal Justice Center | 2739 E Las Vegas St, Colorado Springs, CO 80906 | Verify current rated capacity in latest EPSO annual report |
The OJP abstract gives the design context for the El Paso County jail. Read the OJP abstract on the El Paso County Criminal Justice Center for the build-cost and accreditation details.

The abstract calls out the per-bed build cost and the ACA accreditation status used in El Paso County jail population data discussions.
Note: All El Paso County jail population data on this page should be cross-checked against the most recent EPSO annual report before being used in any filing or research piece.
Average Daily Population
Average daily population, or ADP, is the standard measure. The Colorado Division of Criminal Justice defines ADP as the number of confined inmates each day for a year divided by the number of days in the year. The 4th Judicial District uses the same definition. ADP smooths daily booking spikes into one number that fits in a chart.
The most complete public ADP figures for El Paso County come from the 2020 CJCC Metrics Report. The report gives quarterly ADP with the pretrial share. Quarter one ran at 1,538 ADP at 65 percent pretrial. Quarter two dropped to 1,032 ADP at 73 percent pretrial. The drop tracks the early COVID release wave. Quarter three rose to 1,164 ADP at 74 percent pretrial. Quarter four hit 1,280 ADP at 79 percent pretrial. The trend shows partial rebound and a rising pretrial share over the year.
| Period | El Paso County ADP | Pretrial Share |
|---|---|---|
| 2020 Q1 | 1,538 | 65% |
| 2020 Q2 | 1,032 | 73% |
| 2020 Q3 | 1,164 | 74% |
| 2020 Q4 | 1,280 | 79% |
The 2020 series is historical. Current ADP for El Paso County must be pulled from the most recent EPSO annual report. Treat 2020 numbers as context, not as a current jail count.
Demographic Breakdown
Demographic breakdowns for El Paso County jail population data are not published in a clean public table by EPSO. The Vera Institute fills part of that gap at the state level. Vera reports race counts and racial-disparity ratios for the Colorado jail and prison system. Vera's Colorado page also shows arrest rates by race over time. For a county-level cut, request the data from the Sheriff under the Colorado Open Records Act.
| Group | Data Source | Notes |
|---|---|---|
| Gender split (male / female) | EPSO annual report | Verify current year before publishing. |
| Race / ethnicity | Vera Institute (state) / EPSO (county on request) | State-level data is available; county detail needs a CORA request. |
| Age | EPSO annual report | Adult jail population; juveniles routed to other facilities. |
Vera's state file is the easiest starting point for racial-disparity context. Open the Vera Institute Colorado state page for the racial breakdown and arrest-rate series.
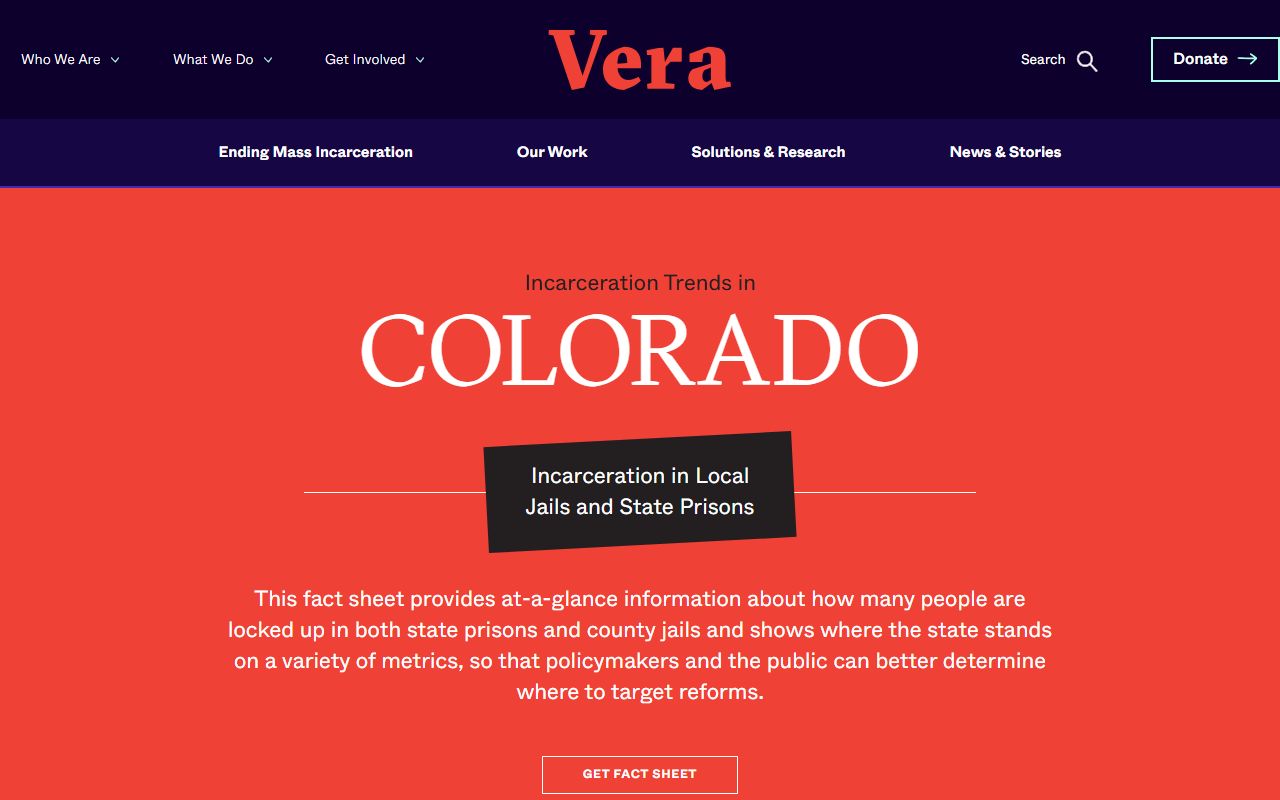
The Vera page shows Colorado-wide racial disparity in jail counts and lets readers spot which trends apply to El Paso County.
Pretrial vs Sentenced Population
The split between pretrial and sentenced people in jail drives most jail policy talk. Pretrial people sit in jail before any conviction. Sentenced people are serving time after a plea or verdict. The El Paso County jail held a rising pretrial share through 2020. The pretrial share moved from 65 percent in Q1 to 79 percent in Q4 that year. A higher pretrial share usually points to slower court calendars, higher bond amounts, or more failure-to-appear holds.
| Status | 2020 Q4 Share | What It Means |
|---|---|---|
| Pretrial | 79% | Held before trial or plea; charges not yet resolved. |
| Sentenced | 21% | Serving a jail term after conviction. |
The Colorado DCJ jail dashboard tracks the pretrial share at the state level. Read the DCJ jail data definitions page for how the state defines pretrial, sentenced, and ADP.
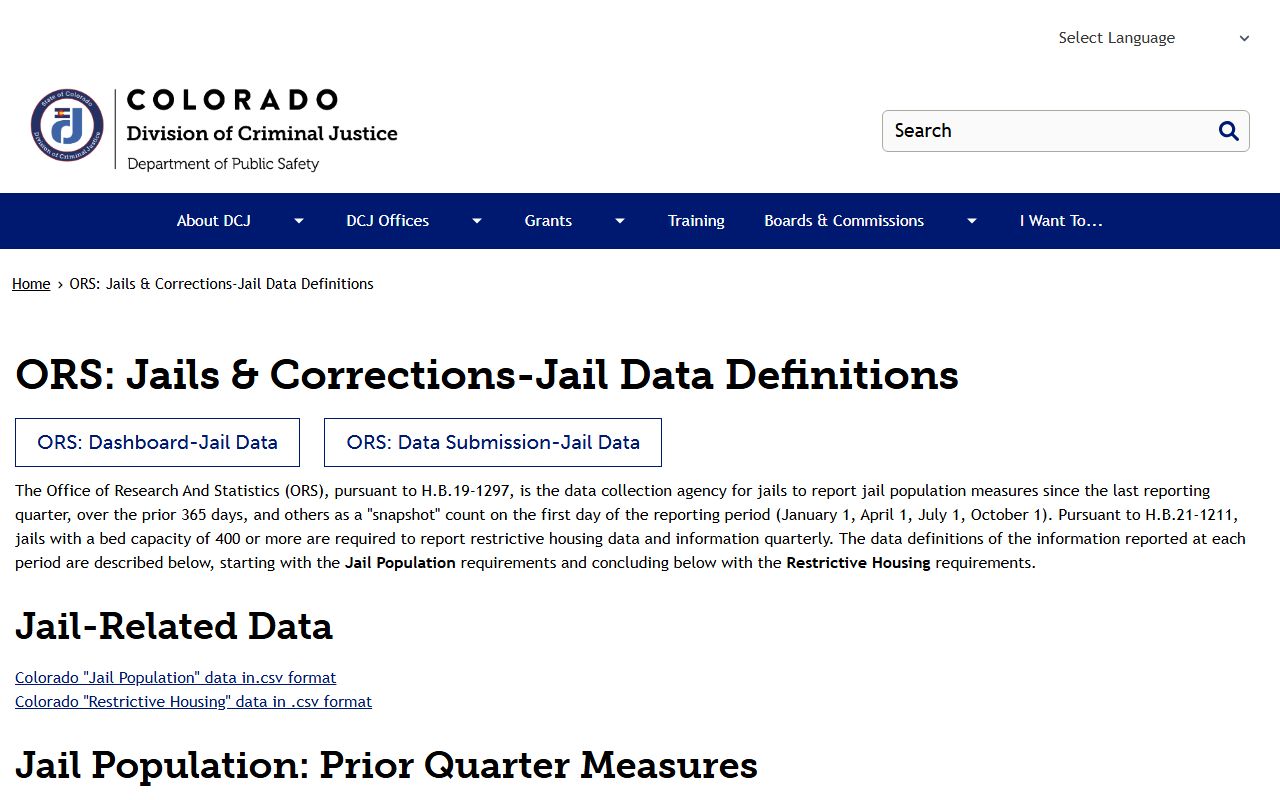
The DCJ page is the official key for reading any El Paso County jail population data table that uses ADP and pretrial share terms.
Note: A pretrial share above 70 percent is a flag for slower case flow and is worth tracking on each new El Paso County annual report.
Misdemeanor vs Felony Population
El Paso County jail population data does not always split out misdemeanor and felony counts in one public table. Felony cases route to the 4th Judicial District Court. Misdemeanor cases route to county court or municipal court. Most people held longer than a few weeks at the Criminal Justice Center face a felony charge. People with a misdemeanor often clear bond or get a summons and never appear in jail population data at all.
The Sheriff's inmate search shows a charge level on each booking. Felony, misdemeanor, traffic, and warrant levels all appear in live records. Researchers can tally a sample of bookings by level to estimate the split, but that is not the same as an official report. For a clean misdemeanor and felony count, file a CORA request with the Sheriff.
Mental Health and Medical Population
A share of the El Paso County jail population gets mental health or medical care while in custody. EPSO has a Medical Services unit at the Criminal Justice Center. The unit handles intake screening, daily clinic, and chronic-care follow-up. Ward B4 holds visitation rules specific to mental health holds. People on B4 with a mental health flag may get up to two visits per day, which is higher than other wards.
Statewide context comes from Vera and BJS. Colorado jail populations include a meaningful share of people with serious mental illness or substance use disorders. Exact El Paso County figures live in the annual report and may not appear in every public release. Treat any number quoted here without a source as a research gap.
National and State Context
El Paso County jail population data lands inside a bigger Colorado and U.S. picture. The Vera Institute reports Colorado jail and prison rates per 100,000 residents. BJS publishes the national jail incarceration rate in its Annual Survey of Jails. Reading the county rate next to the state and national rate helps frame whether the El Paso County jail is running hot, average, or low compared to peers. The table below holds a placeholder structure. Final per-100,000 figures should be pulled from the most recent BJS and Vera releases before any number is published.
| Level | Jail Population per 100,000 | Source |
|---|---|---|
| El Paso County | Pull from latest EPSO annual report / Sheriff CORA | County-specific |
| Colorado | Pull from latest Vera Colorado state file | State context |
| National | Pull from latest BJS Annual Survey of Jails | National benchmark |
The BJS landing page is the access point for the national rate. Open the Bureau of Justice Statistics home page to find the most recent Annual Survey of Jails release.
BJS posts each jail series with a PDF and a data table. Pull the latest year before quoting a national rate in any El Paso County jail population data write-up.
Population Trends Over Time
Multi-year trend data for the El Paso County jail population is partial in the public source set. The 2020 CJCC Metrics Report is the cleanest quarterly file. Each EPSO annual report adds a year-end ADP figure. For 2021 through 2025, the official annual reports should be pulled in PDF and read side by side. The Vera Colorado page adds a state trend line that runs longer.
For now, the 2020 series is the anchor. ADP moved from 1,538 in Q1 to 1,032 in Q2 during the early COVID drop. ADP then rose to 1,164 in Q3 and 1,280 in Q4. Pretrial share rose across the year. Until each new EPSO annual report is loaded, treat 2020 as the last clean public series and label it as such.
Searching for El Paso County Inmate Records by Name
This page covers aggregate El Paso County jail population data. For name-based lookups of people in custody right now, use El Paso County inmate records. The Sheriff's live search returns booking number, charges, bond, and ward. People released in the last few days route through released inmates. The two record types are different files. Population data does not list names; the roster does.
Where the Data Comes From
El Paso County jail population data flows from four official sources. The Sheriff's Office publishes annual reports with year-end ADP and bookings. The 2020 CJCC Metrics Report holds quarterly ADP and pretrial percentages. The Colorado Division of Criminal Justice posts state-level jail definitions and dashboards. BJS and the Vera Institute add national and racial-disparity context. None of these files is real-time. Each is a snapshot built from booking and release logs filed by the jail.
For deeper questions, file a CORA request with the El Paso County Sheriff's Office. The Sheriff's records team handles requests for jail data not posted online. For court-side filings tied to those bookings, see El Paso County court records and the 4th Judicial District Court page. For broader public-records work, see El Paso County public records.
Note: Always cite the source and the year for any El Paso County jail population data number; mixing years from different sources is the most common reporting error.